This document presents a detailed analysis of the various parameters used in the Genetic Algorithm for optimizing circuit configurations. The goal is to determine the optimal settings for each parameter to ensure efficient and effective performance of the algorithm.
Introduction
Genetic Algorithms (GAs) are powerful optimization tools inspired by the principles of natural selection and genetics. The performance of GAs is highly dependent on the proper tuning of their parameters. This analysis focuses on two main categories of parameters:
- Algorithm Parameters
- Circuit Parameters
Algorithm Parameters Analysis
Population Size
Population size determines the number of individuals in each generation. A larger population size increases the genetic diversity but also requires more computational resources.
Analysis Results
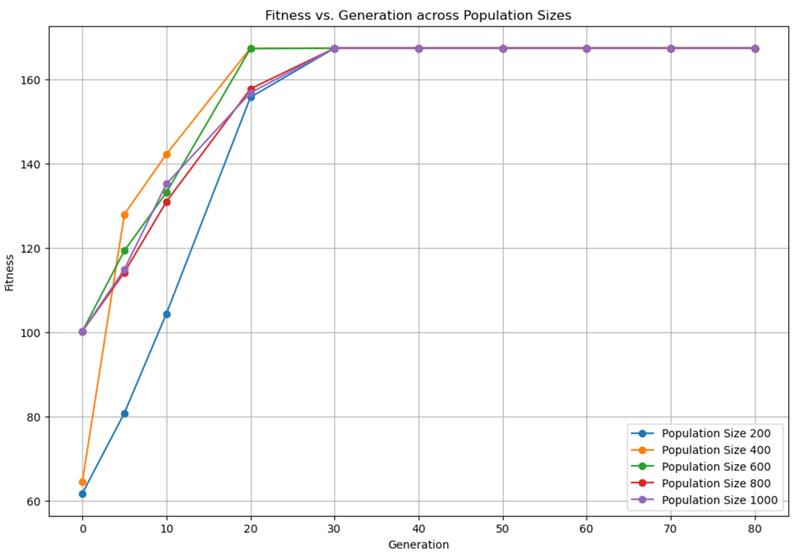
- Population sizes of 600, 800, and 1000 start with relatively high initial fitness values, indicating that they quickly find high-quality solutions.
- The fitness values increase rapidly in the early generations.
- A population size of 400 shows the fastest increase in fitness, reaching 167.378 by generation 20.
- All population sizes eventually stabilize at a fitness value of 167.378, demonstrating effective convergence of the algorithm.
Parameter Choice
A population size of 400 is optimal as it balances computational cost and convergence speed effectively.
Tournament Size
Tournament size determines the number of individuals randomly selected from the population for each tournament. The winner of each tournament, being the individual with the highest fitness, is selected to be a parent for the next generation.
Analysis Results
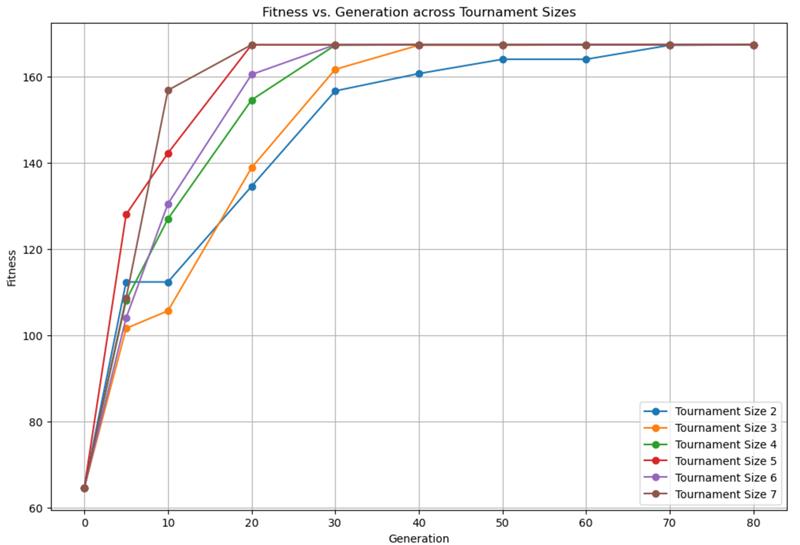
- All tournament sizes show a rapid increase in fitness within the first 10 generations.
- Tournament Size 5 reaches the highest fitness value (around 165) by generation 20 and remains stable.
- Sizes 6 and 7 also achieve high fitness values but are slightly lower than Tournament Size 5.
Parameter Choice
Choosing a tournament size of 5 ensures that the genetic algorithm efficiently explores the solution space and quickly converges to high-quality solutions, making it suitable for most optimization problems.
Crossover Rate
The crossover rate is a probability value (usually between 0 and 1) that dictates the likelihood of applying the crossover operation to generate new offspring from two parent individuals. It helps control the genetic diversity in the population by mixing genes from different parents.
Analysis Results
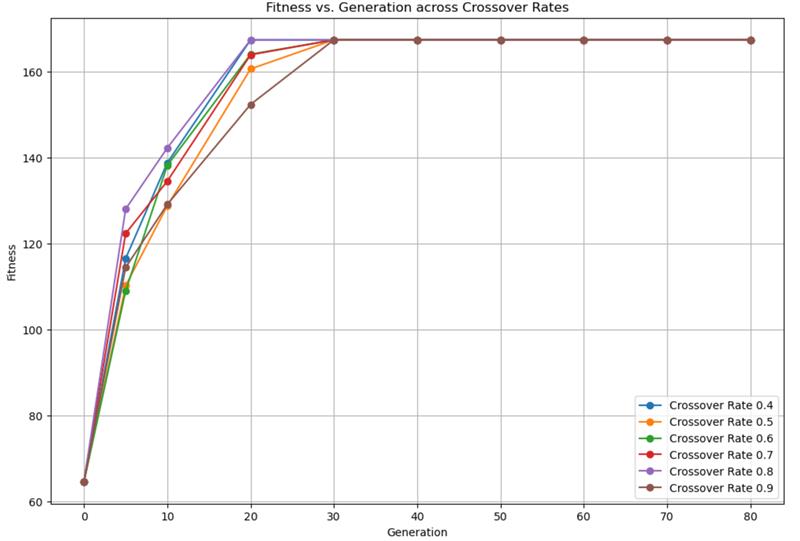
- Crossover rates of 0.7 and 0.8 demonstrate the fastest convergence, achieving the maximum fitness value the quickest.
- All crossover rates eventually reach the same maximum fitness value, indicating robustness across different rates.
Parameter Choice
For future runs, consider using a crossover rate of 0.8 to achieve the fastest improvement and robust performance.
Mutation Rate
Mutation rate is a crucial parameter in genetic algorithms, representing the probability of randomly altering genes in an individual's genome. It helps maintain genetic diversity within the population, preventing premature convergence to local optima and enabling the exploration of the solution space.
Analysis Results
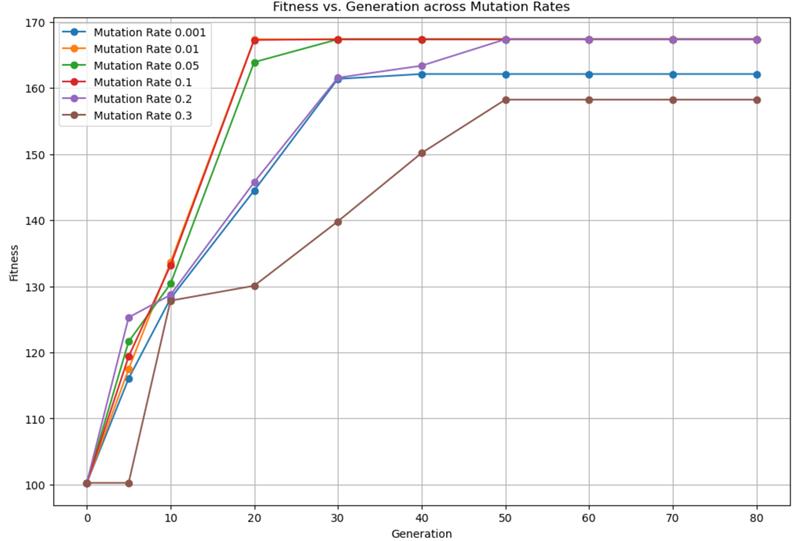
- Lower mutation rates (0.01, 0.05, and 0.1) demonstrate quicker convergence and higher final fitness values compared to higher mutation rates (0.2 and 0.3).
- Mutation rate 0.01 shows the fastest and most stable improvement.
Parameter Choice
Use a mutation rate of 0.01 to achieve rapid convergence and robust performance.
Elite Percentage
The elitePercentage parameter in a genetic algorithm controls the elitism strategy. This strategy directly preserves the best-performing individuals from the current generation into the next generation without any mutation or crossover. This ensures that the top-quality genes are passed on, enhancing the algorithm's efficiency and stability.
Analysis Results
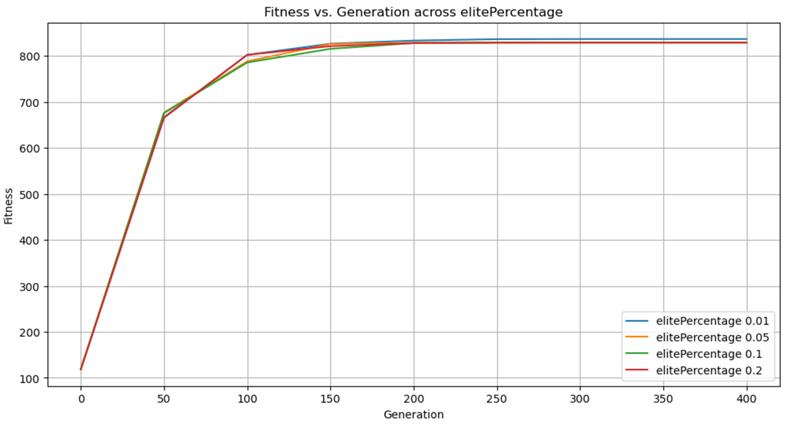
- elitePercentage values of 0.01 show the highest fitness values consistently, reaching a fitness of 836.835 by generation 250.
- elitePercentage values of 0.05, 0.1, and 0.2 show slower fitness increases, with all stabilizing around 829.175 by generation 250.
Parameter Choice
0.01 ensures rapid convergence to high fitness values while maintaining the robustness of the genetic algorithm.
Circuit Parameters Analysis
Number of Units
The number of units in the circuit configuration can significantly affect performance metrics like elapsed time, performance, recovery, and grade.
Analysis Results
| Num Units | Elapsed Time (s) | Performance | Recovery | Grade | Final Circuit Configuration |
|---|---|---|---|---|---|
| 4 | 1.35789 | 110.25 | 0.150332 | 0.965671 | 2 1 1 2 4 0 0 0 3 3 0 2 5 |
| 6 | 2.45652 | 232.583 | 0.280938 | 0.977566 | 1 6 5 5 5 2 3 0 5 1 5 2 4 5 2 7 0 0 2 |
| 8 | 4.5209 | 341.632 | 0.37187 | 0.989275 | 4 7 7 1 7 0 3 0 3 6 0 1 4 0 3 5 0 3 2 0 3 9 8 0 0 |
| 10 | 6.82153 | 437.72 | 0.471582 | 0.990517 | 0 8 1 6 2 7 0 10 8 8 8 1 4 8 1 9 8 0 11 8 1 3 2 8 1 2 2 7 8 1 5 |
Visualization
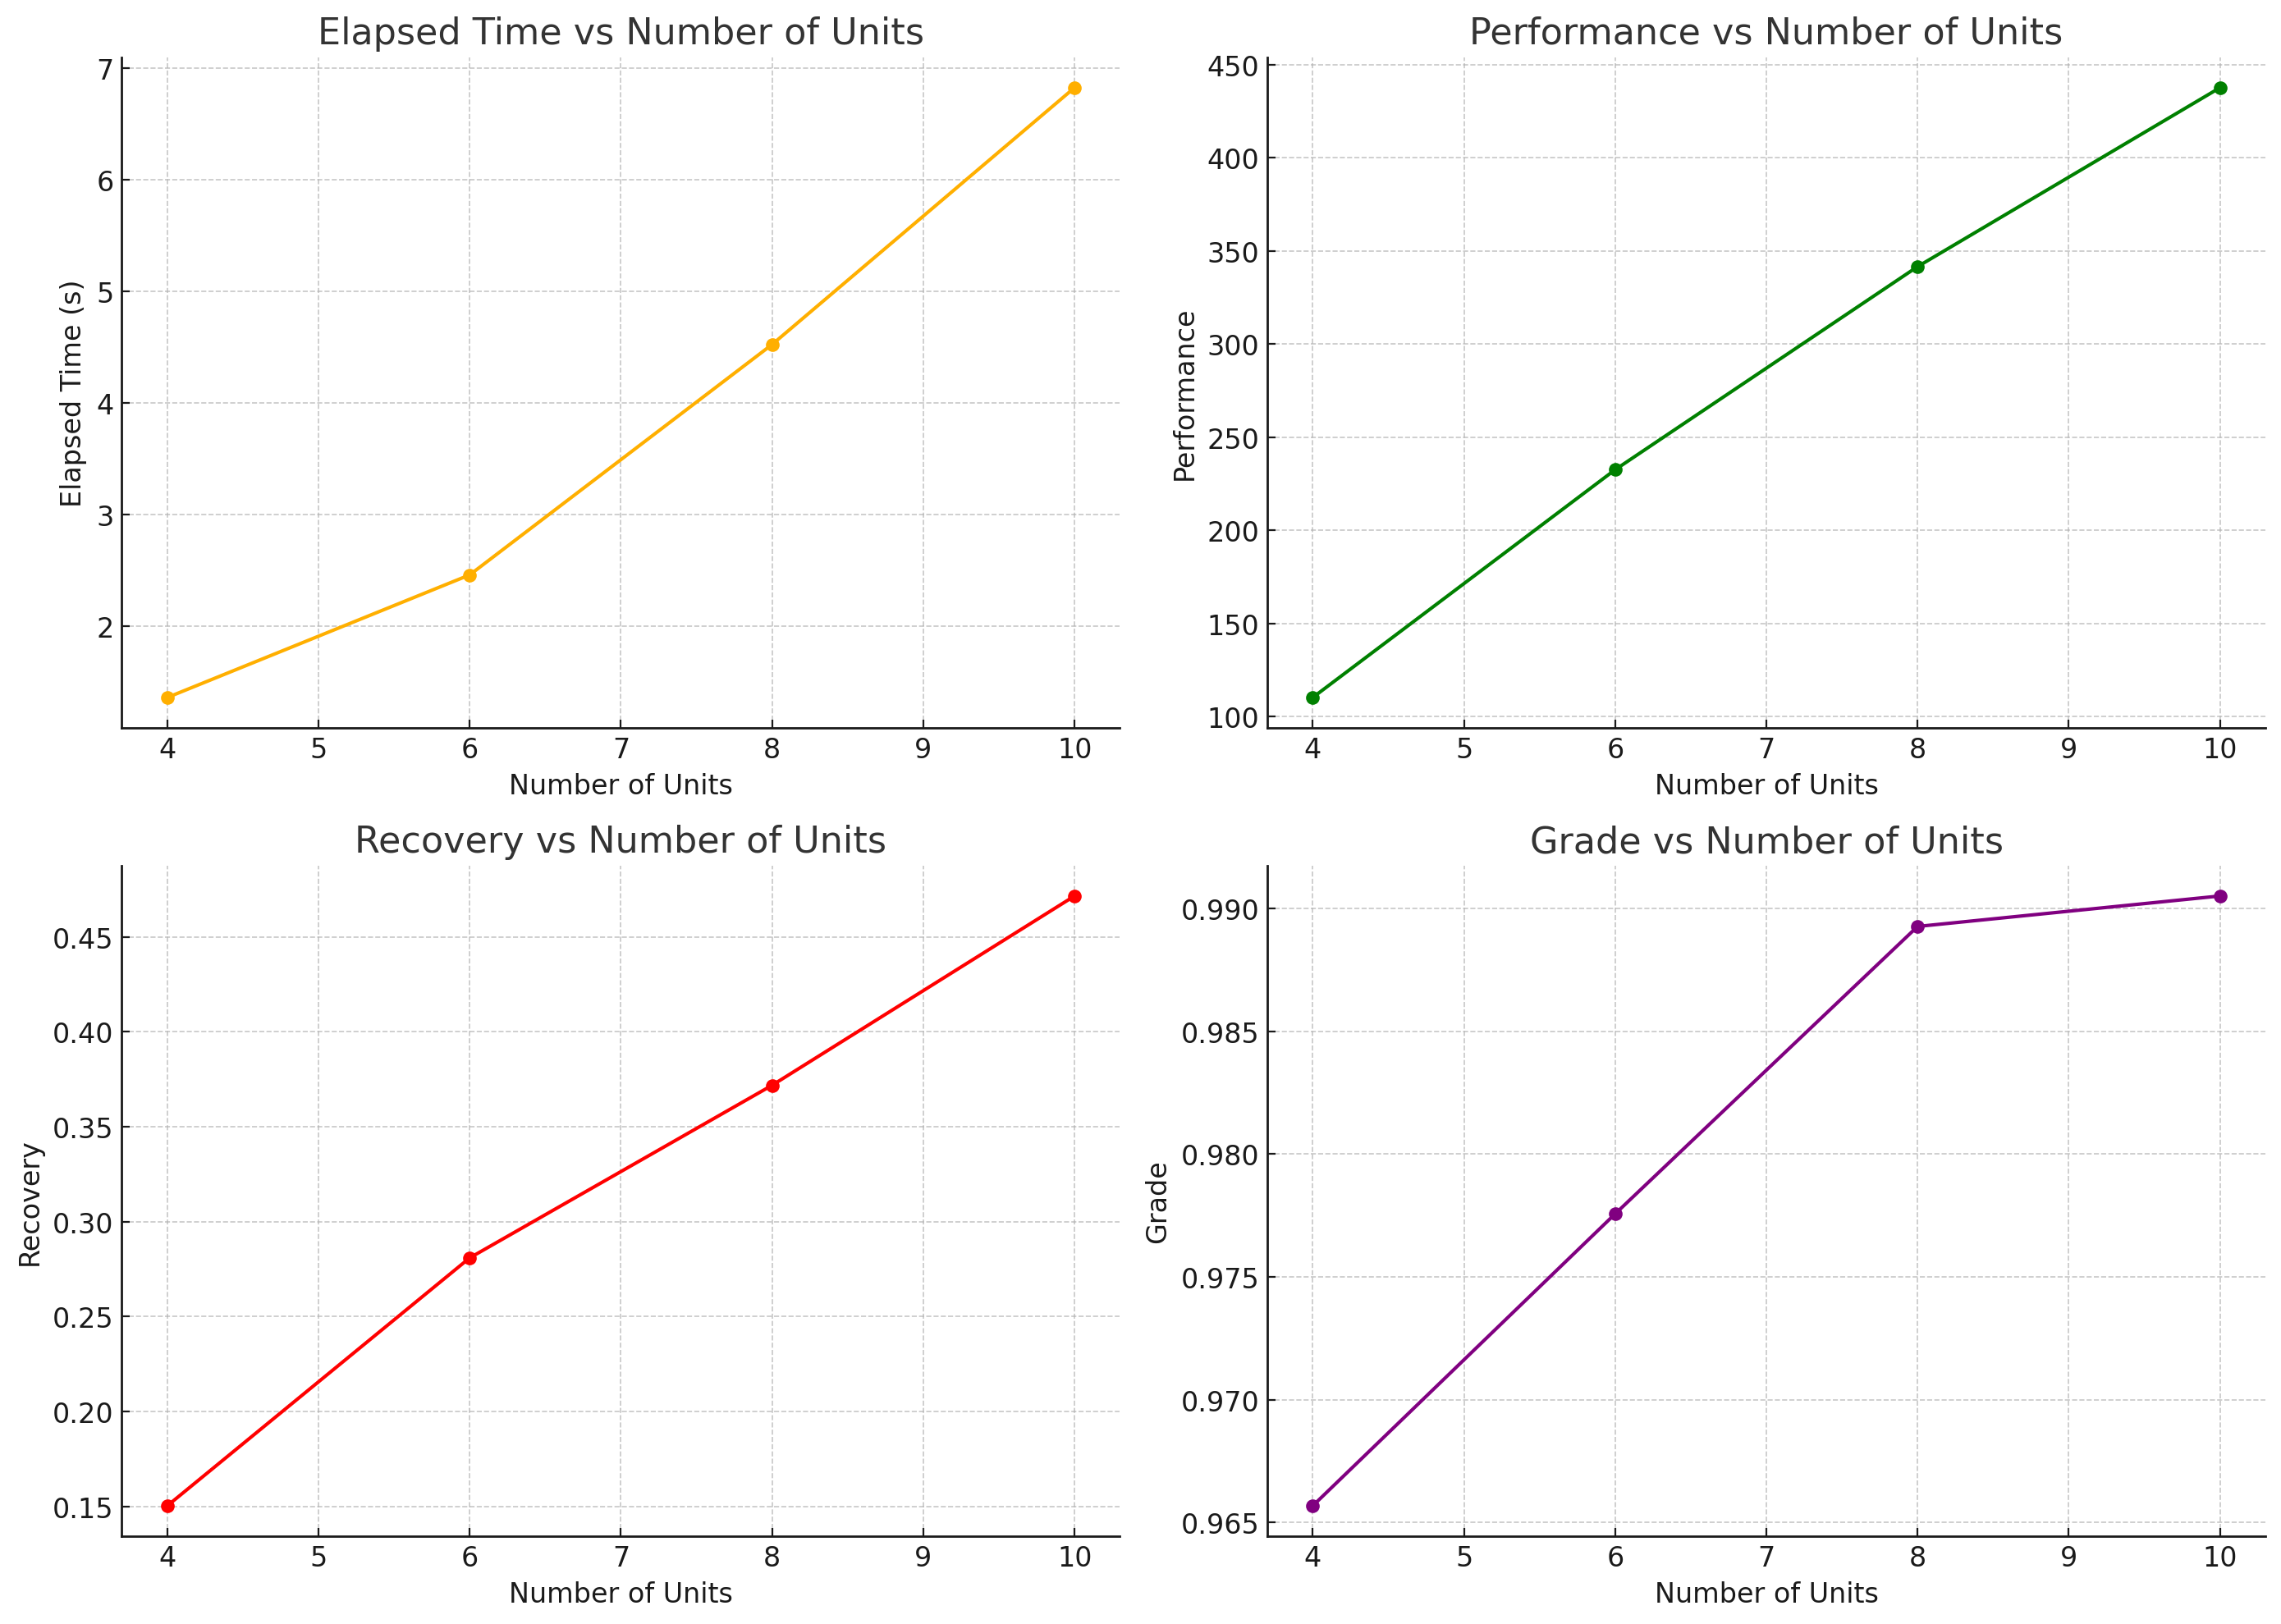
Trends
- Elapsed Time: Increases almost linearly with the number of units, reflecting increased complexity and processing time.
- Performance: Improves significantly with an increasing number of units, indicating better processing capabilities and efficiency.
- Recovery: Increases with the number of units, suggesting improved system capacity to recover from errors or faults.
- Grade: Slight improvement with the number of units, indicating overall better performance and efficiency in larger configurations.
Purity of Input Feed (Gerardium:Waste Feed Ratio)
The purity of the input feed, represented as the ratio of gerardium feed to waste feed, can significantly affect performance metrics like elapsed time, performance, recovery, and grade.
Analysis Results
| Gerardium:Waste Feed | Elapsed Time (s) | Performance | Recovery | Grade | Final Circuit Configuration |
|---|---|---|---|---|---|
| 10:90 | 6.64633 | 437.72 | 0.471582 | 0.990517 | 5 7 1 6 2 3 5 10 7 7 2 7 1 7 1 0 7 1 8 7 1 9 2 2 3 7 1 4 7 5 11 |
| 20:80 | 6.44538 | 862.07 | 0.494251 | 0.983232 | 8 3 6 9 3 6 4 5 3 6 10 5 2 3 6 11 10 3 3 5 2 8 3 2 0 5 2 7 3 6 1 |
| 30:70 | 6.97441 | 1320.43 | 0.498122 | 0.984718 | 7 2 2 8 2 8 9 10 10 3 10 2 0 2 8 1 3 8 11 2 0 4 2 0 6 2 3 7 2 8 5 |
| 40:60 | 6.51499 | 1838.62 | 0.522236 | 0.984274 | 5 10 10 7 0 5 6 0 5 11 10 0 5 0 3 9 0 3 8 0 5 2 10 0 3 0 3 4 0 3 1 |
| 50:50 | 6.95478 | 2369.51 | 0.534505 | 0.985107 | 7 10 8 4 8 4 6 8 4 1 10 8 0 10 3 7 8 0 9 8 4 11 8 0 5 10 10 3 8 0 2 |
| 60:40 | 6.10315 | 3029.69 | 0.652294 | 0.970762 | 6 10 8 3 9 8 4 10 8 1 10 8 2 9 8 5 9 6 7 10 9 0 9 6 11 10 9 6 10 10 8 |
| 70:30 | 5.96057 | 4044.07 | 0.758418 | 0.969211 | 5 10 5 3 10 5 0 10 5 1 10 5 8 10 5 2 10 4 4 5 5 7 5 2 11 10 5 9 10 5 6 |
| 80:20 | 5.83807 | 5417.92 | 0.816378 | 0.97778 | 2 10 2 1 10 2 6 10 3 3 10 2 7 2 5 11 10 2 8 10 2 4 10 2 5 10 2 9 10 2 0 |
| 90:10 | 5.46021 | 7134.92 | 0.902775 | 0.984013 | 7 10 7 5 10 2 9 10 7 3 10 7 0 10 7 8 10 7 4 10 10 2 10 10 6 10 7 1 10 5 11 |
Visualization
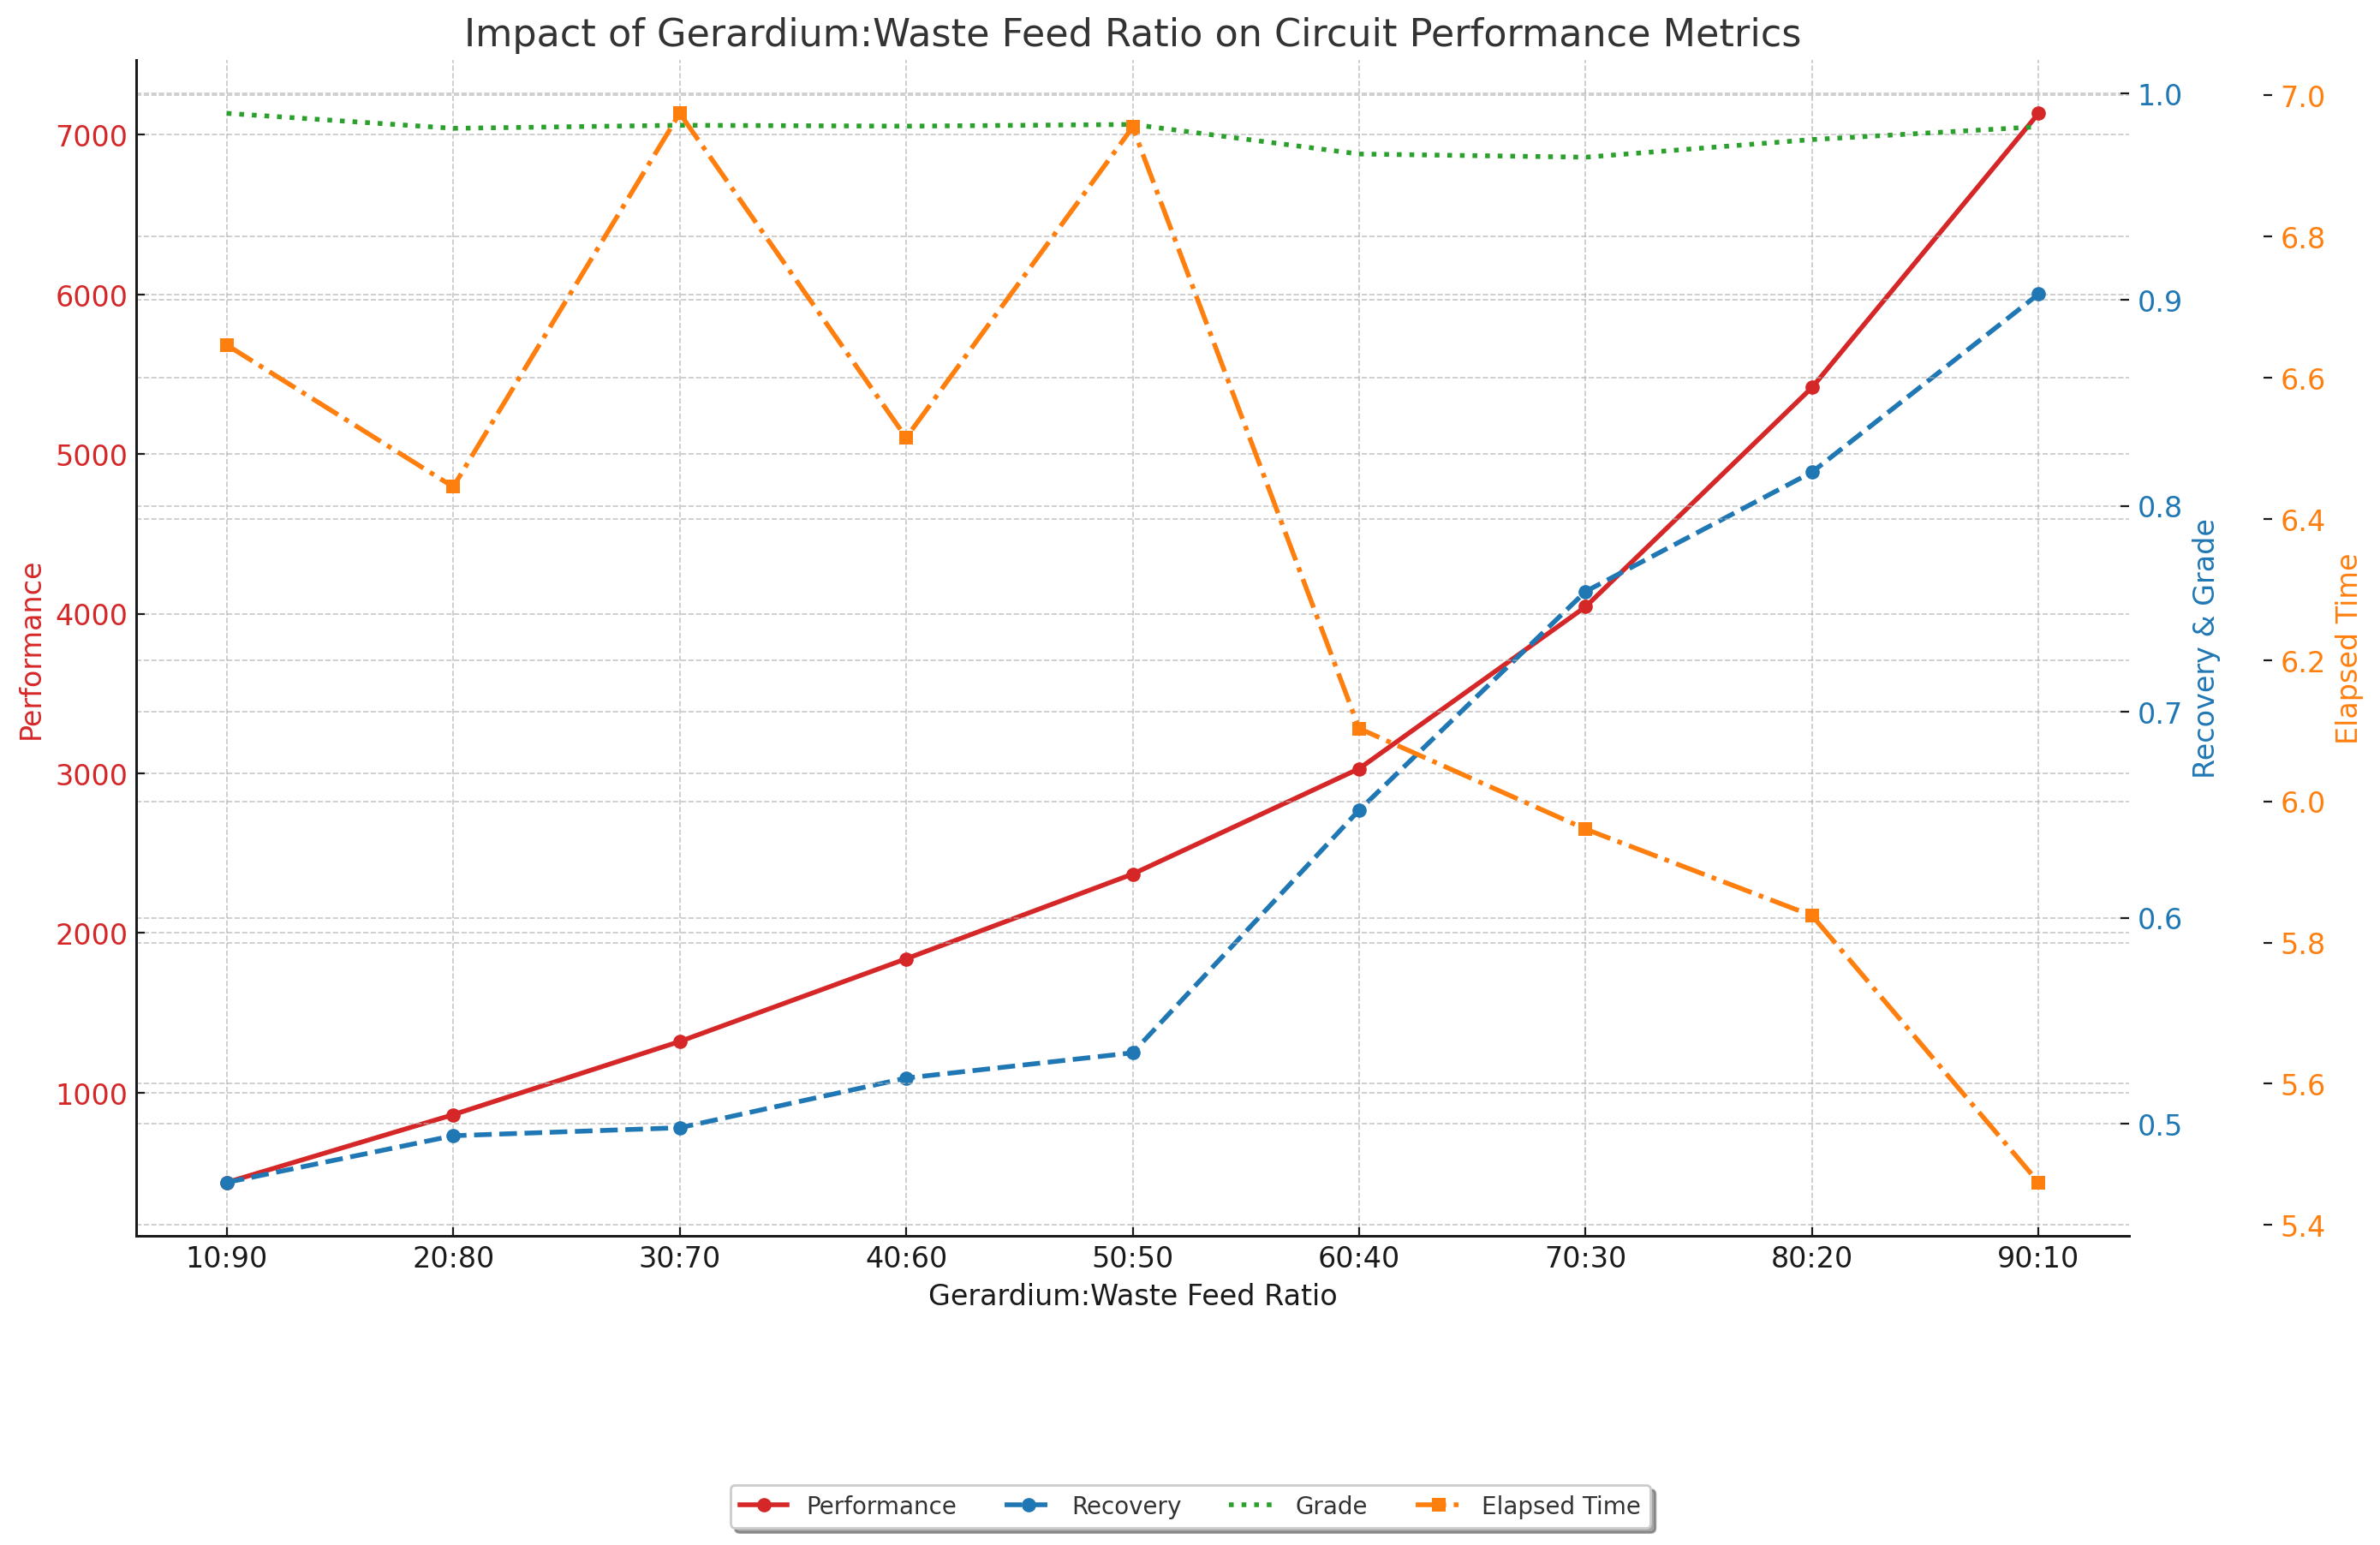
Trends
- Performance (red line, circles) shows a significant increase as the proportion of gerardium feed increases.
- Recovery (blue line, dashed) improves with higher gerardium feed, indicating better extraction efficiency.
- Grade (green line, dotted) remains relatively stable with slight fluctuations.
- Elapsed Time (orange line, squares) shows a decreasing trend, suggesting improved computational efficiency with higher purity feeds.
Price Ratio of Gerardium to Waste Disposal
The economic parameters, specifically the reward for gerardium and the penalties for waste disposal, significantly affect the performance metrics of the circuit. This analysis examines how changes in these economic parameters impact the optimum circuit configuration, performance, recovery, and grade.
Analysis Results
Default reward and penalty is 100 and -750.
| Reward/Penalty Coefficient | Num Units | Elapsed Time (s) | Performance | Recovery | Grade | Final Circuit Configuration |
|---|---|---|---|---|---|---|
| Reward of £100 * 5 per kg | 5 | 1.99066 | 167.379 | 0.202835 | 0.977224 | 3 1 4 6 2 2 4 5 1 1 1 4 0 1 1 3 |
| Reward of £100 * 5 per kg | 10 | 6.86852 | 437.72 | 0.471582 | 0.990517 | 1 6 9 8 6 9 2 6 9 4 10 6 6 6 9 0 3 6 9 3 3 5 6 1 11 6 9 7 3 5 1 |
| Reward of £100 * 10 per kg | 5 | 2.08692 | 167.379 | 0.202835 | 0.977224 | 2 3 4 6 5 3 3 3 4 0 1 1 4 3 3 2 |
| Reward of £100 * 10 per kg | 10 | 6.76027 | 437.72 | 0.471582 | 0.990517 | 0 7 5 3 7 0 11 7 5 1 7 5 9 7 5 2 6 8 0 10 7 7 6 6 8 6 7 5 7 5 4 |
| Penalty of £750 * 5 per kg | 5 | 1.94702 | 167.379 | 0.202835 | 0.977224 | 1 5 4 4 4 3 2 4 3 6 4 4 1 0 0 3 |
| Penalty of £750 * 5 per kg | 10 | 6.7229 | 437.72 | 0.471582 | 0.990517 | 7 6 9 1 6 9 4 5 6 9 6 9 8 6 9 3 10 6 6 5 5 2 6 9 0 6 7 11 5 2 7 |
| Penalty of £750 * 10 per kg | 5 | 1.87025 | 162.125 | 0.196688 | 0.977106 | 0 3 4 4 5 3 3 3 0 6 1 1 0 3 0 2 |
| Penalty of £750 * 10 per kg | 10 | 7.42508 | 437.72 | 0.471582 | 0.990517 | 2 9 2 11 9 8 7 9 8 1 6 9 8 9 8 0 9 8 4 10 9 9 9 8 5 6 3 2 6 6 3 |
Visualization
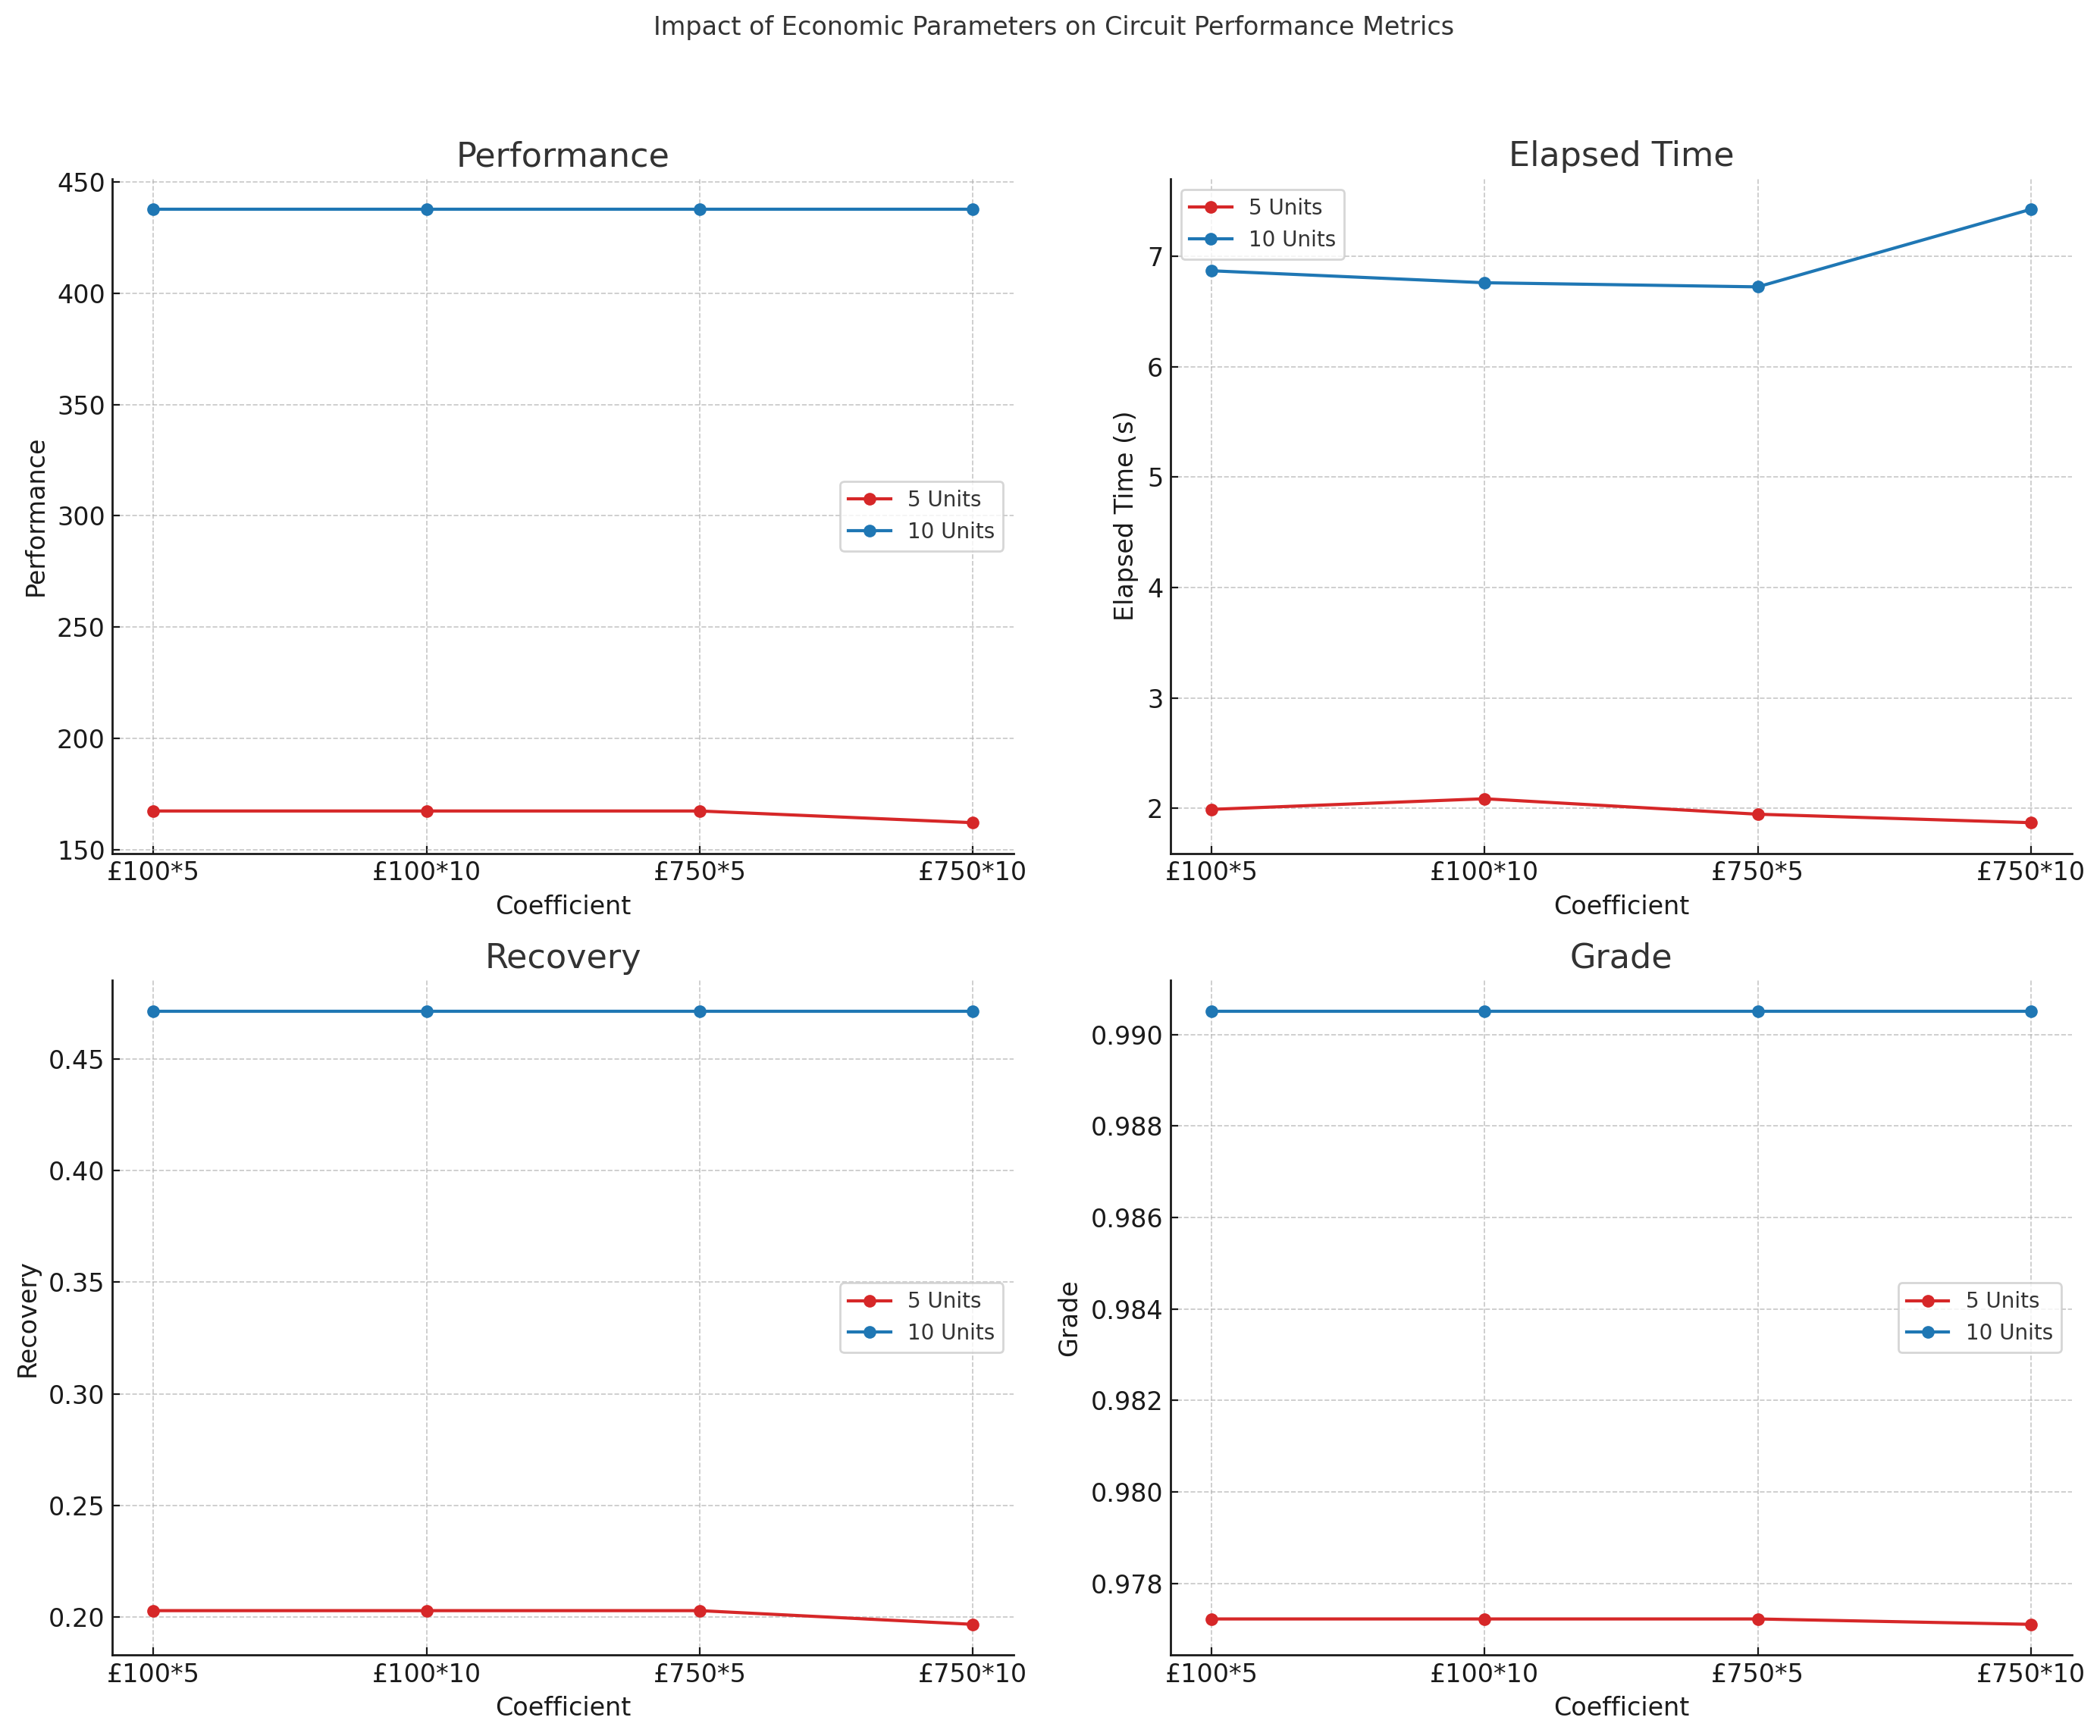
The visualizations above show the impact of different economic parameters on the circuit performance metrics for configurations with 5 and 10 units:
- Performance: Remains constant at 167.379 for lower penalty coefficients but drops to 162.125 when the penalty increases significantly. For 10 units, the performance remains stable at 437.72 across all economic parameters.
- Elapsed Time: Shows slight variations but generally increases with higher penalties. For 5 units, elapsed time decreases slightly with increased reward but rises with higher penalties.
- Recovery: Remains relatively constant for both 5 and 10 units, indicating that recovery is less sensitive to changes in economic coefficients.
- Grade: Remains stable for both 5 and 10 units, showing minimal fluctuation.
Recommendations
- Optimize for Higher Units: Configurations with more units (10 units) are less sensitive to economic parameter changes, maintaining stable performance and grade.
- Penalty Management: When penalties for waste disposal are high, consider optimizing circuit configurations to minimize waste, as higher penalties can negatively impact performance.
- Reward Adjustments: Increasing rewards has minimal impact on performance and recovery, suggesting that optimizing for penalties might be more critical in achieving better economic outcomes.